Topics
- Review of model evaluation procedures
- Steps for K-fold cross-validation
- Comparing cross-validation to train/test split
- Cross-validation recommendations
- Cross-validation example: parameter tuning
- Cross-validation example: model selection
- Cross-validation example: feature selection
- Improvements to cross-validation
- Resources
This tutorial is derived from Data School's Machine Learning with scikit-learn tutorial. I added my own notes so anyone, including myself, can refer to this tutorial without watching the videos.
1. Review of model evaluation procedures
Motivation: Need a way to choose between machine learning models
- Goal is to estimate likely performance of a model on out-of-sample data
Initial idea: Train and test on the same data
- But, maximizing training accuracy rewards overly complex models which overfit the training data
Alternative idea: Train/test split
- Split the dataset into two pieces, so that the model can be trained and tested on different data
- Testing accuracy is a better estimate than training accuracy of out-of-sample performance
- Problem with train/test split
- It provides a high variance estimate since changing which observations happen to be in the testing set can significantly change testing accuracy
- Testing accuracy can change a lot depending on a which observation happen to be in the testing set
from sklearn.datasets import load_iris
from sklearn.cross_validation import train_test_split
from sklearn.neighbors import KNeighborsClassifier
from sklearn import metrics
# read in the iris data
iris = load_iris()

# create X (features) and y (response)
X = iris.data
y = iris.target
# use train/test split with different random_state values
# we can change the random_state values that changes the accuracy scores
# the accuracy changes a lot
# this is why testing accuracy is a high-variance estimate
X_train, X_test, y_train, y_test = train_test_split(X, y, random_state=6)

# check classification accuracy of KNN with K=5
knn = KNeighborsClassifier(n_neighbors=5)
knn.fit(X_train, y_train)
y_pred = knn.predict(X_test)
metrics.accuracy_score(y_test, y_pred)
Question: What if we created a bunch of train/test splits, calculated the testing accuracy for each, and averaged the results together?
Answer: That's the essense of cross-validation!
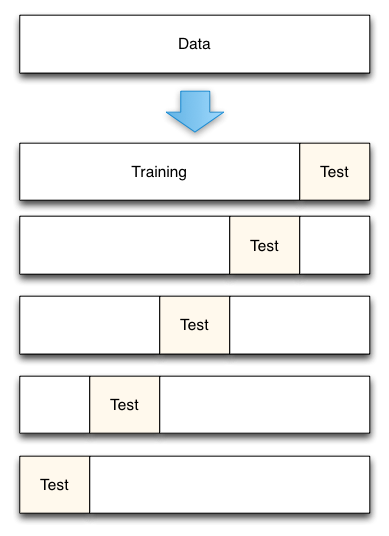
2. Steps for K-fold cross-validation
- Split the dataset into K equal partitions (or "folds")
- So if k = 5 and dataset has 150 observations
- Each of the 5 folds would have 30 observations
- Use fold 1 as the testing set and the union of the other folds as the training set
- Testing set = 30 observations (fold 1)
- Training set = 120 observations (folds 2-5)
- Calculate testing accuracy
- Repeat steps 2 and 3 K times, using a different fold as the testing set each time
- We will repeat the process 5 times
- 2nd iteration
- fold 2 would be the testing set
- union of fold 1, 3, 4, and 5 would be the training set
- 3rd iteration
- fold 3 would be the testing set
- union of fold 1, 2, 4, and 5 would be the training set
- And so on...
- Use the average testing accuracy as the estimate of out-of-sample accuracy
Diagram of 5-fold cross-validation:
# simulate splitting a dataset of 25 observations into 5 folds
from sklearn.cross_validation import KFold
kf = KFold(25, n_folds=5, shuffle=False)


# print the contents of each training and testing set
# ^ - forces the field to be centered within the available space
# .format() - formats the string similar to %s or %n
# enumerate(sequence, start=0) - returns an enumerate object
print('{} {:^61} {}'.format('Iteration', 'Training set obsevations', 'Testing set observations'))
for iteration, data in enumerate(kf, start=1):
    print('{!s:^9} {} {!s:^25}'.format(iteration, data[0], data[1]))
- Dataset contains 25 observations (numbered 0 through 24)
- 5-fold cross-validation, thus it runs for 5 iterations
- For each iteration, every observation is either in the training set or the testing set, but not both
- Every observation is in the testing set exactly once
3. Comparing cross-validation to train/test split
Advantages of cross-validation:
- More accurate estimate of out-of-sample accuracy
- More "efficient" use of data
- This is because every observation is used for both training and testing
Advantages of train/test split:
- Runs K times faster than K-fold cross-validation
- This is because K-fold cross-validation repeats the train/test split K-times
- Simpler to examine the detailed results of the testing process
4. Cross-validation recommendations
- K can be any number, but K=10 is generally recommended
- This has been shown experimentally to produce the best out-of-sample estimate
- For classification problems, stratified sampling is recommended for creating the folds
- Each response class should be represented with equal proportions in each of the K folds
- If dataset has 2 response classes
- Spam/Ham
- 20% observation = ham
- Each cross-validation fold should consist of exactly 20% ham
- If dataset has 2 response classes
- scikit-learn's
cross_val_scorefunction does this by default
- Each response class should be represented with equal proportions in each of the K folds
5. Cross-validation example: parameter tuning
Goal: Select the best tuning parameters (aka "hyperparameters") for KNN on the iris dataset
- We want to choose the best tuning parameters that best generalize the data
from sklearn.cross_validation import cross_val_score
# 10-fold cross-validation with K=5 for KNN (the n_neighbors parameter)
# k = 5 for KNeighborsClassifier
knn = KNeighborsClassifier(n_neighbors=5)

# Use cross_val_score function
# We are passing the entirety of X and y, not X_train or y_train, it takes care of splitting the dat
# cv=10 for 10 folds
# scoring='accuracy' for evaluation metric - althought they are many
scores = cross_val_score(knn, X, y, cv=10, scoring='accuracy')
print(scores)
- In the first iteration, the accuracy is 100%
- Second iteration, the accuracy is 93% and so on
cross_val_score executes the first 4 steps of k-fold cross-validation steps which I have broken down to 7 steps here in detail
- Split the dataset (X and y) into K=10 equal partitions (or "folds")
- Train the KNN model on union of folds 2 to 10 (training set)
- Test the model on fold 1 (testing set) and calculate testing accuracy
- Train the KNN model on union of fold 1 and fold 3 to 10 (training set)
- Test the model on fold 2 (testing set) and calculate testing accuracy
- It will do this on 8 more times
- When finished, it will return the 10 testing accuracy scores as a numpy array
# use average accuracy as an estimate of out-of-sample accuracy
# numpy array has a method mean()
print(scores.mean())
Our goal here is to find the optimal value of K
# search for an optimal value of K for KNN

# range of k we want to try
k_range = range(1, 31)
# empty list to store scores
k_scores = []

# 1. we will loop through reasonable values of k
for k in k_range:
    # 2. run KNeighborsClassifier with k neighbours
    knn = KNeighborsClassifier(n_neighbors=k)
    # 3. obtain cross_val_score for KNeighborsClassifier with k neighbours
    scores = cross_val_score(knn, X, y, cv=10, scoring='accuracy')
    # 4. append mean of scores for k neighbors to k_scores list
    k_scores.append(scores.mean())


print(k_scores)
# in essence, this is basically running the k-fold cross-validation method 30 times because we want to run through K values from 1 to 30
# we should have 30 scores here
print('Length of list', len(k_scores))
print('Max of list', max(k_scores))
# plot how accuracy changes as we vary k
import matplotlib.pyplot as plt
%matplotlib inline

# plot the value of K for KNN (x-axis) versus the cross-validated accuracy (y-axis)
# plt.plot(x_axis, y_axis)
plt.plot(k_range, k_scores)
plt.xlabel('Value of K for KNN')
plt.ylabel('Cross-validated accuracy')

The maximum cv accuracy occurs from k=13 to k=20
The general shape of the curve is an upside down yield
- This is quite typical when examining the model complexity and accuracy
- This is an example of bias-variance trade off
- Low values of k (low bias, high variance)
- The 1-Nearest Neighbor classifier is the most complex nearest neighbor model
- It has the most jagged decision boundary, and is most likely to overfit
- High values of k (high bias, low variance)
- underfit
- Best value is the middle of k (most likely to generalize out-of-sample data)
- just right
- Low values of k (low bias, high variance)
The best value of k
- Higher values of k produce less complex model
- So we will choose 20 as our best KNN model
- Higher values of k produce less complex model
6. Cross-validation example: model selection
Goal: Compare the best KNN model with logistic regression on the iris dataset
# 10-fold cross-validation with the best KNN model
knn = KNeighborsClassifier(n_neighbors=20)

# Instead of saving 10 scores in object named score and calculating mean
# We're just calculating the mean directly on the results
print(cross_val_score(knn, X, y, cv=10, scoring='accuracy').mean())
# 10-fold cross-validation with logistic regression
from sklearn.linear_model import LogisticRegression
logreg = LogisticRegression()
print(cross_val_score(logreg, X, y, cv=10, scoring='accuracy').mean())
We can conclude that KNN is likely a better choice than logistic regression
7. Cross-validation example: feature selection
Goal: Select whether the Newspaper feature should be included in the linear regression model on the advertising dataset
import pandas as pd
import numpy as np
from sklearn.linear_model import LinearRegression
# read in the advertising dataset
data = pd.read_csv('http://www-bcf.usc.edu/~gareth/ISL/Advertising.csv', index_col=0)
# create a Python list of three feature names
feature_cols = ['TV', 'Radio', 'Newspaper']

# use the list to select a subset of the DataFrame (X)
X = data[feature_cols]

# select the Sales column as the response (y)
# since we're selecting only one column, we can select the attribute using .attribute
y = data.Sales
# 10-fold cross-validation with all three features
# instantiate model
lm = LinearRegression()

# store scores in scores object
# we can't use accuracy as our evaluation metric since that's only relevant for classification problems
# RMSE is not directly available so we will use MSE
scores = cross_val_score(lm, X, y, cv=10, scoring='mean_squared_error')
print(scores)
MSE should be positive
- But why is the MSE here negative?
- MSE is a loss function
- It is something we want to minimize
- A design decision was made so that the results are made negative
- The best results would be the largest number (the least negative) so we can still maximize similar to classification accuracy
- Classification Accuracy is a reward function
- It is something we want to maximize
# fix the sign of MSE scores
mse_scores = -scores
print(mse_scores)
# convert from MSE to RMSE
rmse_scores = np.sqrt(mse_scores)
print(rmse_scores)
# calculate the average RMSE
print(rmse_scores.mean())
# 10-fold cross-validation with two features (excluding Newspaper)
feature_cols = ['TV', 'Radio']
X = data[feature_cols]
print(np.sqrt(-cross_val_score(lm, X, y, cv=10, scoring='mean_squared_error')).mean())
Without Newspaper
- Average RMSE = 1.68
- lower number than with model with Newspaper
- RMSE is something we want to minimize
- So the model excluding Newspaper is a better model
8. Improvements to cross-validation
Repeated cross-validation
- Repeat cross-validation multiple times (with different random splits of the data) and average the results
- More reliable estimate of out-of-sample performance by reducing the variance associated with a single trial of cross-validation
Creating a hold-out set
- "Hold out" a portion of the data before beginning the model building process
- Locate the best model using cross-validation on the remaining data, and test it using the hold-out set
- More reliable estimate of out-of-sample performance since hold-out set is truly out-of-sample
Feature engineering and selection within cross-validation iterations
- Normally, feature engineering and selection occurs before cross-validation
- Instead, perform all feature engineering and selection within each cross-validation iteration
- More reliable estimate of out-of-sample performance since it better mimics the application of the model to out-of-sample data
9. Resources
- scikit-learn documentation: Cross-validation, Model evaluation
- scikit-learn issue on GitHub: MSE is negative when returned by cross_val_score
- Section 5.1 of An Introduction to Statistical Learning (11 pages) and related videos: K-fold and leave-one-out cross-validation (14 minutes), Cross-validation the right and wrong ways (10 minutes)
- Scott Fortmann-Roe: Accurately Measuring Model Prediction Error
- Machine Learning Mastery: An Introduction to Feature Selection
- Harvard CS109: Cross-Validation: The Right and Wrong Way
- Journal of Cheminformatics: Cross-validation pitfalls when selecting and assessing regression and classification models