Spam classifier example, error analysis, skewed data, precision, recall and large data sets.
1. Building a Spam Classifier
I would like to give full credits to the respective authors as these are my personal python notebooks taken from deep learning courses from Andrew Ng, Data School and Udemy :) This is a simple python notebook hosted generously through Github Pages that is on my main personal notes repository on https://github.com/ritchieng/ritchieng.github.io. They are meant for my personal review but I have open-source my repository of personal notes as a lot of people found it useful.
1a. Prioritizing
- Let’s say you want to build a spam classifier
- How do you implement supervised learning?
- We can create the following
- x = features of email
- Choose 100 words indicative of spam or not spam
- In practice is to look through training set and choose most frequently occurring n words (10 000 to 50 000)
- y = spam (1) or non-spam (0)
- Example
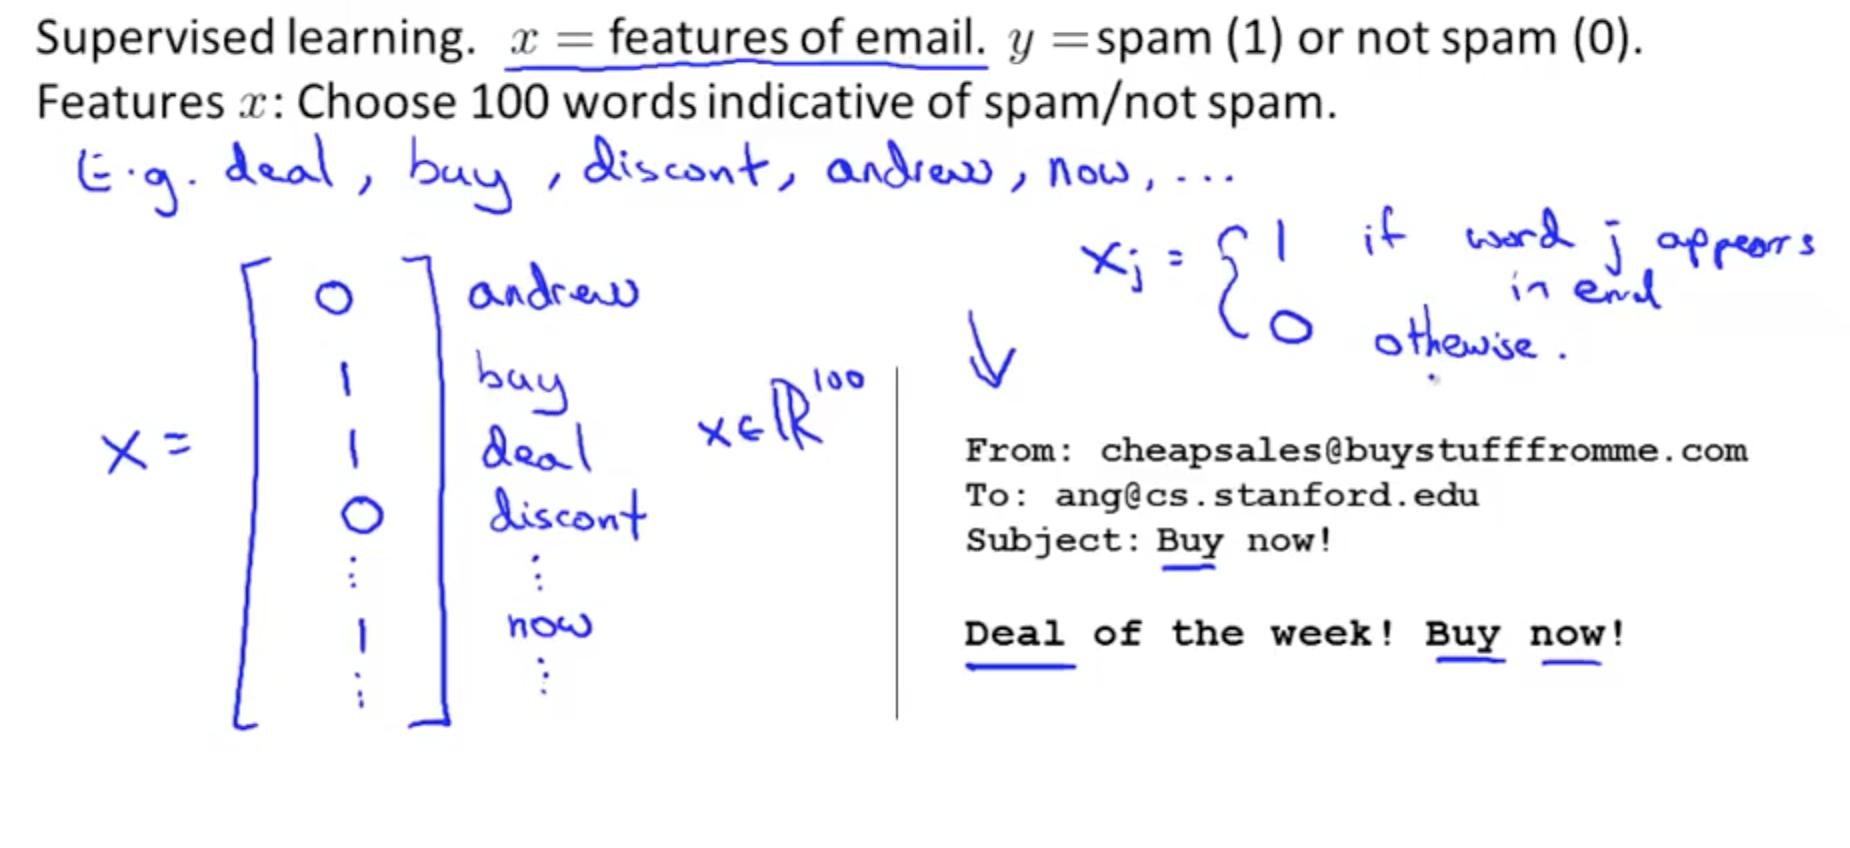
- x = features of email
- We can create the following
- How do you spend your time to have a low error?
- Collect lots of data
- Develop sophisticated features based on email routing information (from email header)
- Develop sophisticated features for message body
- Should ‘discount’ and ‘discounts’ be treated as the same word?
- How about ‘deal’ and ‘Dealer’?
- Punctuation?
- Develop sophisticated algorithm to detect misspellings
- med1cine
- w4tches
- m0rtage
- Don’t base on your gut feeling!
1b. Error Analysis
- Recommended Approach
- Start with a simple algorithm that you can quickly implement and test it on your cross validation data
- Plot learning curves to decide if more data, more features, etc. are likely to help
- Error analysis:
- Manually examine the examples (in cross validation set) that your algorithm made errors on
- See if you spot any systematic trend in what type of examples it is making errors on
- Don’t base anything off your gut feeling!
- Error Analysis Example
- m_cv = 500
- number of cross-validation examples
- Algorithm misclassified 100 emails
- Manually examine the 100 errors and categorize them base don
- What type of email they are
- Pharma: 12
- Replica: 4
- Phishing: 53
- Other: 31
- What cues (features) you think would have helped the algorithms classify them correctly
- Deliberate misspellings: 5
- m0rtgage
- med1cine
- This indicates how there are a small number here
- Unusual email routing: 16
- Unusual punctuation: 32
- This might be worthwhile to spend time to develop sophisticated features
- Deliberate misspellings: 5
- What type of email they are
- This is the reason why we should do a quick and dirty implementation to discover errors and identify areas to focus on
- m_cv = 500
- Importance of numerical evaluation
- Should discount, discounts, discounted, discounting etc. be treated as the same word?
- You can use a “stemming” software, “Porter Stemmer”
- This would allow you to treat all those variations as the same work
- Software may mistake universe and university as the same word
- Error analysis may not be helpful for deciding if this is likely to improve performance
- The only way is to try it
- We need a numerical solution (cross validation error)of algorithm’s performance with and without stemming
- Without stemming: 5%
- With stemming: 3%
- This implies that it may be useful to implement stemming
- Distinguish between upper and lower case: 3.2%
- Should discount, discounts, discounted, discounting etc. be treated as the same word?
- Why is the recommended approach to perform error analysis using the cross validation data instead of the test data?
- If we develop new features by examining the test set, then we may end up choosing features that work well specifically for the test set, so Jtest(θ) is no longer a good estimate of how we generalize to new examples
- Do error analysis on cross validation set, do not use it on the test set!
2. Handling Skewed Data
2a. Error Metrics for Skewed Classes
- Consider a problem where you want to find out if someone has cancer
- y = 1, cancer
- y = 0, no cancer
- You train a logistic regression model, h0(x) and you find that you have 1% error on a test set
- 99% correct diagnosis
- But only 0.50% of patients have cancer
- This is a problem of skewed classes
- This code would have a 0.5% error, lower than your logistic regression model but it’s simply predicting based on 0.5% of patients who have cancer
  function y = predictCancer(x)
  y = 0;
  return
- Let’s say you have
- 99.2% accuracy
- 0.8% error
- If you improve your algorithm to become 99.5% accuracy
- 0.5% error
- It might be the case of just predicting whether you have cancer that would yield this error
- 99.2% accuracy
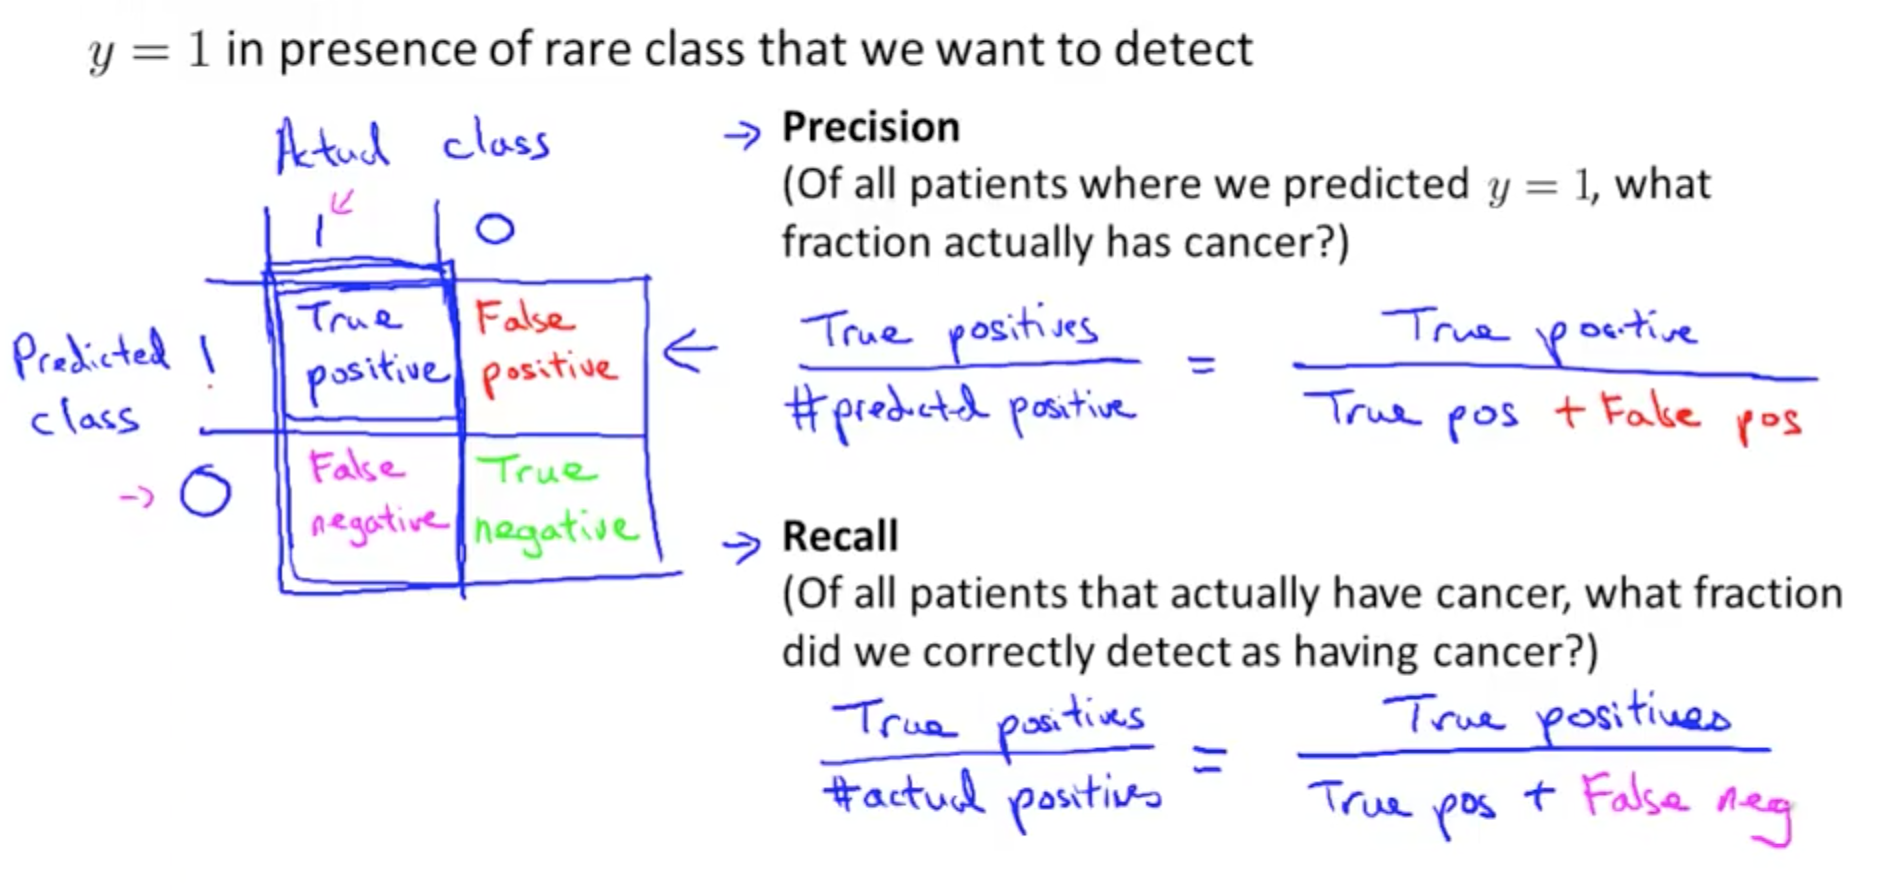
- Precision/Recall
- By calculating precision/recall, we will have a better sense of how our algorithm is doing
- If y = 0
- Recall = 0
- This shows that the classifier is not good
- If y = 0
- By calculating precision/recall, we will have a better sense of how our algorithm is doing
2b. Trading off Precision and Recall
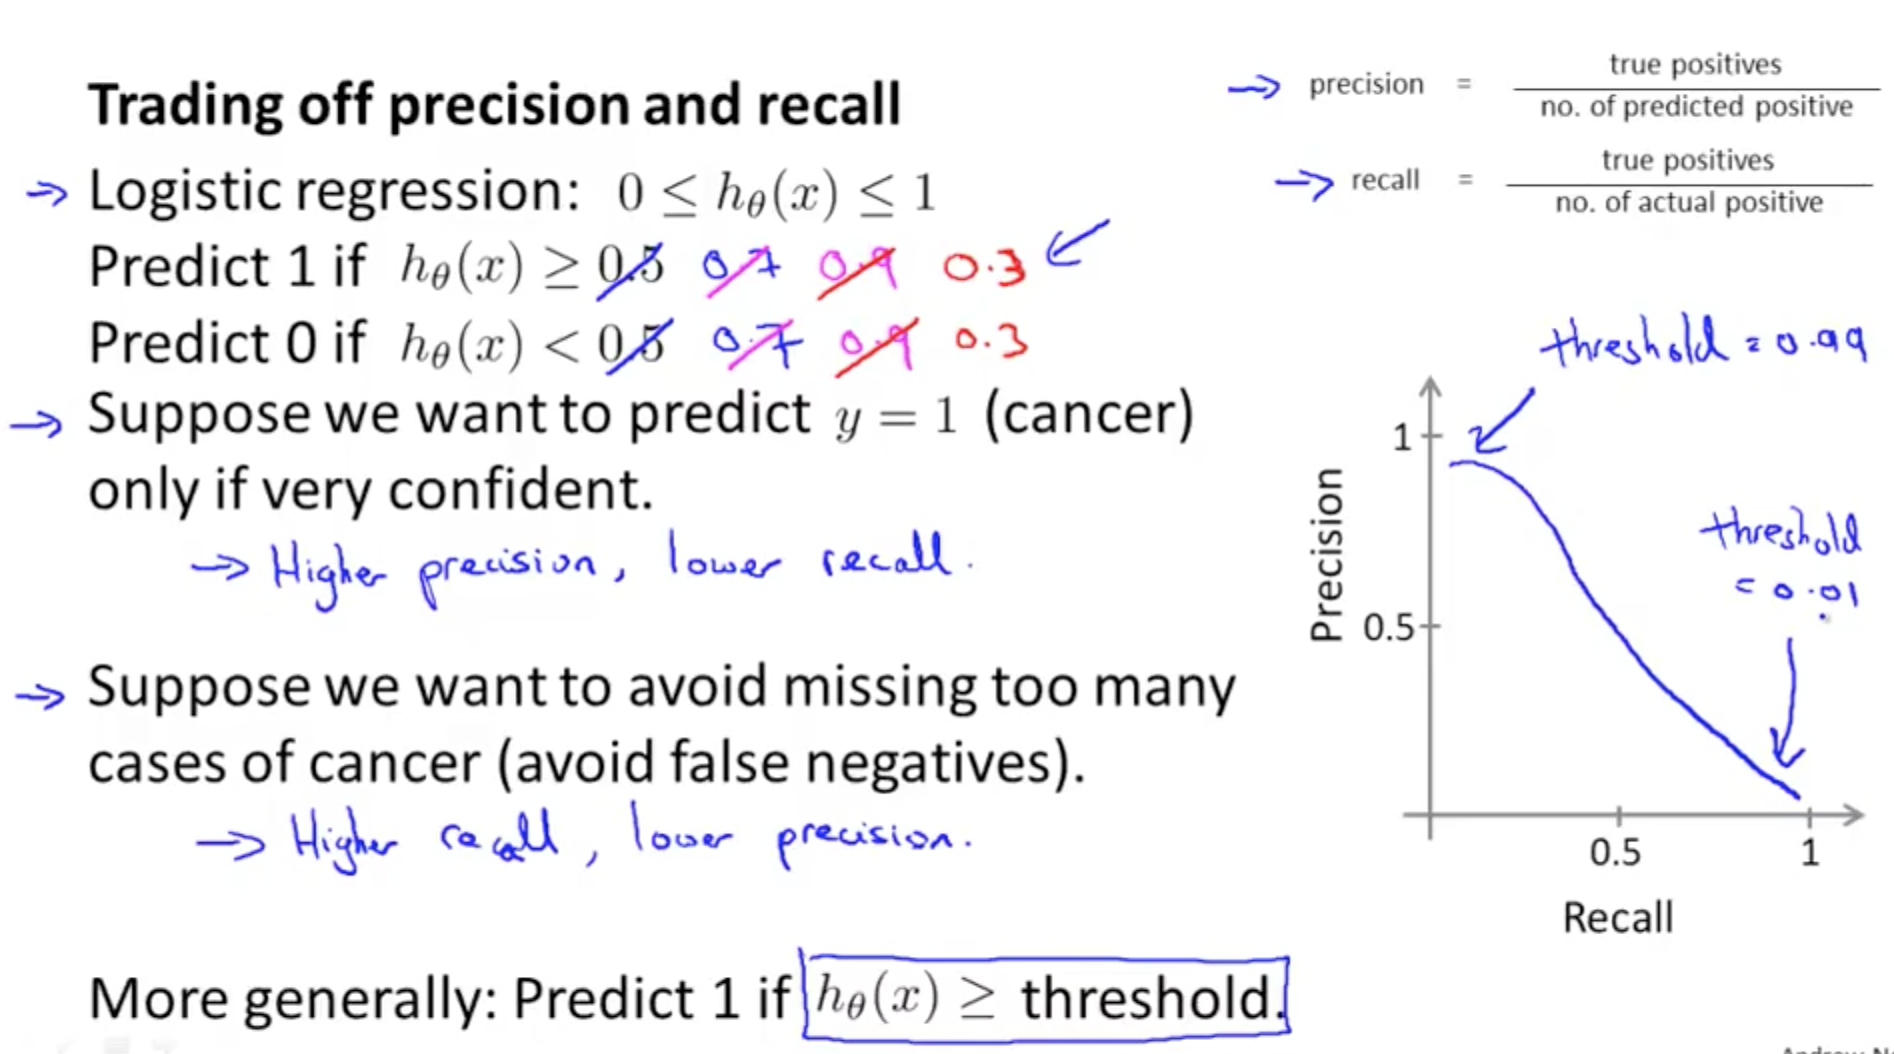
- If we want to avoid false positives
- We want to be more confident before predicting cancer (y = 1)
- We can increase the threshold of h0(x) from 0.5 to 0.7 or even 0.9
- Result
- False positives: decrease
- True positives: decrease
- Recall: decrease
- Precision: higher
- If we want to avoid false negatives
- We want to avoid missing too many cases of cancer
- We can decrease the threshold of h0(x) from 0.5 to 0.3
- Result
- False negatives: decrease
- True positive: increase
- Recall: higher
- Precision: lower
- Many different precision recall curve, but here is one example
- How do we compare precision/recall numbers? Which pair is best?
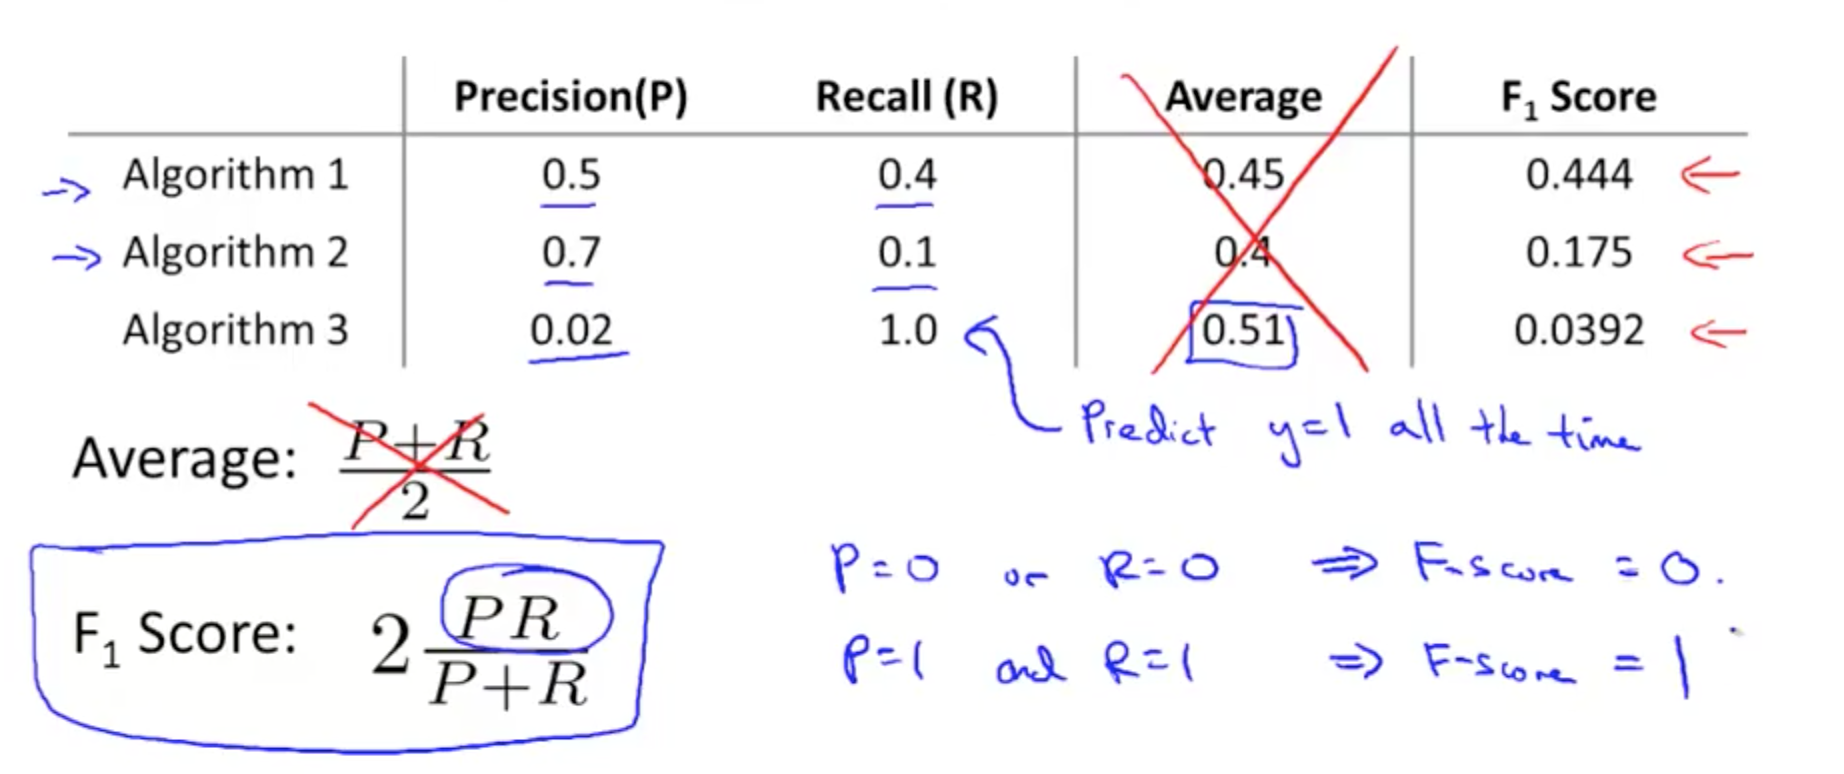
- We can use an average
- At the extremes, neither classifiers is good
- If we predict y = 1 all the time, it’s a useless classifier even though if it has a high recall
- But average is not good because the extreme scenarios may have a lower average than other combinations that may be better
- We should use the F score (F1 score)
- F1 Score = (2 * P * R) / (P + R)
- Remember to measure P and R on the cross-validation set and choose the threshold which maximizes the F-score
- We can use an average
3. Using Large Data Sets
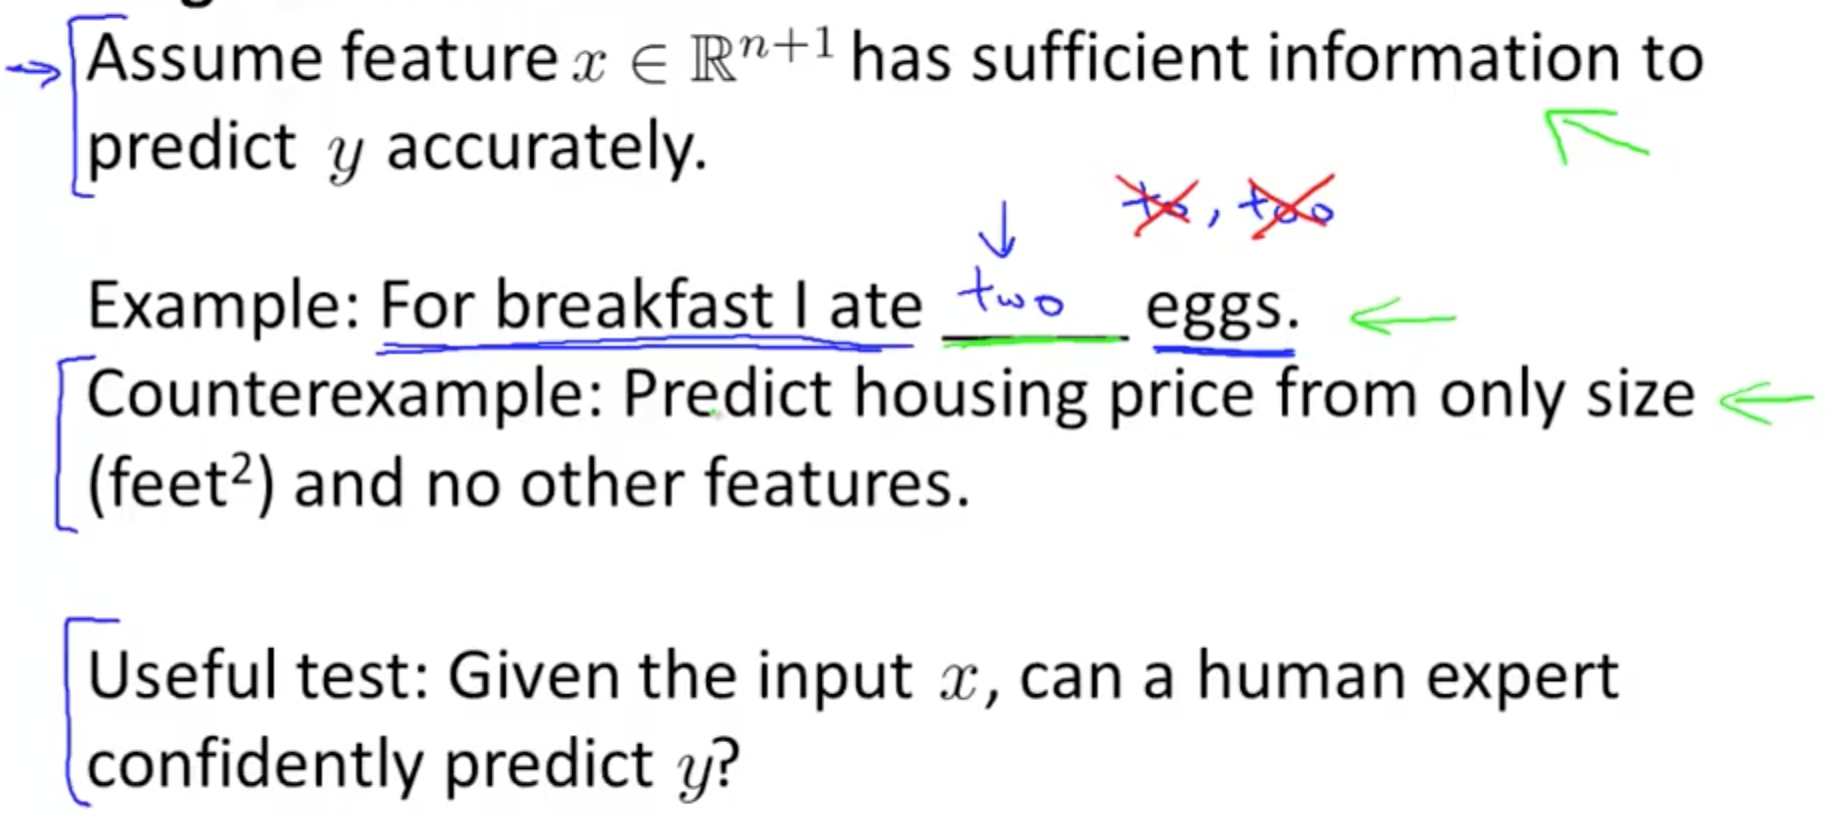
- Under certain conditions, getting a lot of data and training a learning algorithm would result in very good performance
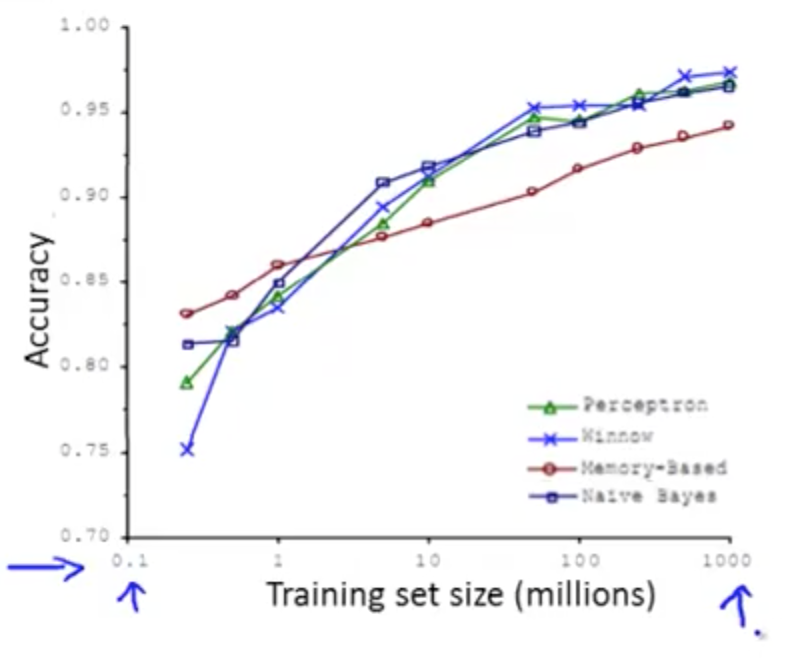
- Designing a high accuracy learning system
- Classify between confusable words
- to, two, too
- then, than
- For breakfast, I ate two eggs
- Algorithms
- Perceptron (logistic regression)
- Winnow (less popular)
- Memory-based (less popular)
- Naive Bayes (popular)
- Algorithms give roughly similar performance
- With larger training set, all algorithms’ precision increase
- With larger training set, all algorithms’ precision increase
- Classify between confusable words
- Often, it is not who has the best algorithm, but who has the most data
- Large data rationale
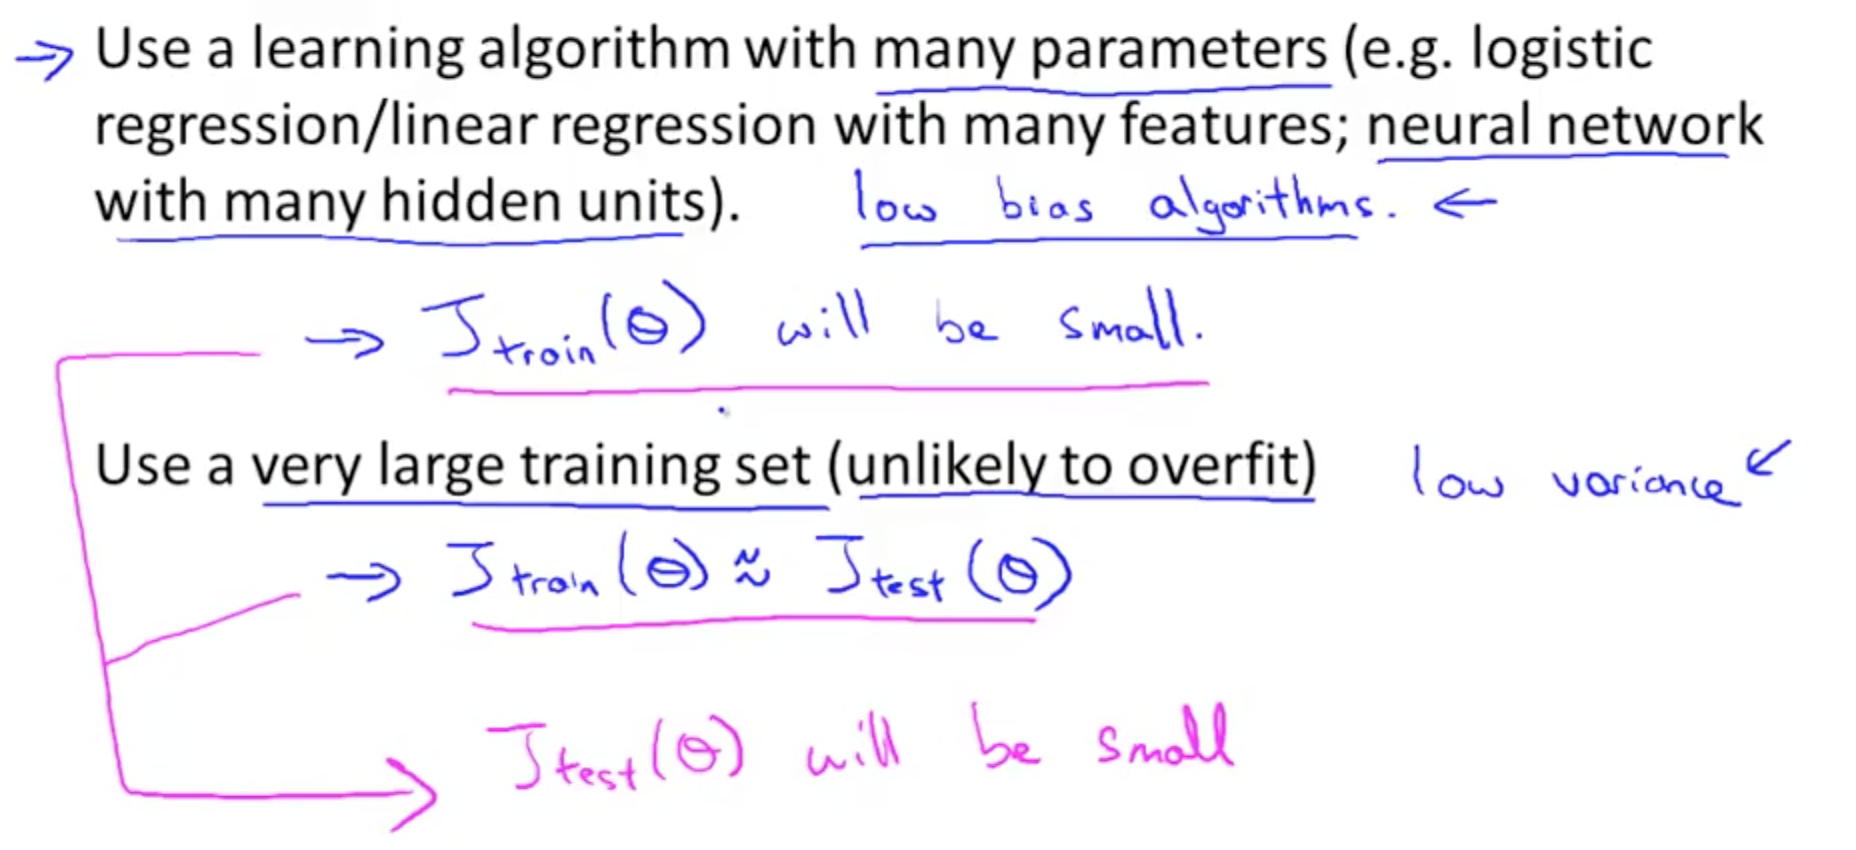
- In sum
- Low bias: use complex algorithm
- Low variance: use large training set